Skip to collection list
Skip to video grid
Trending
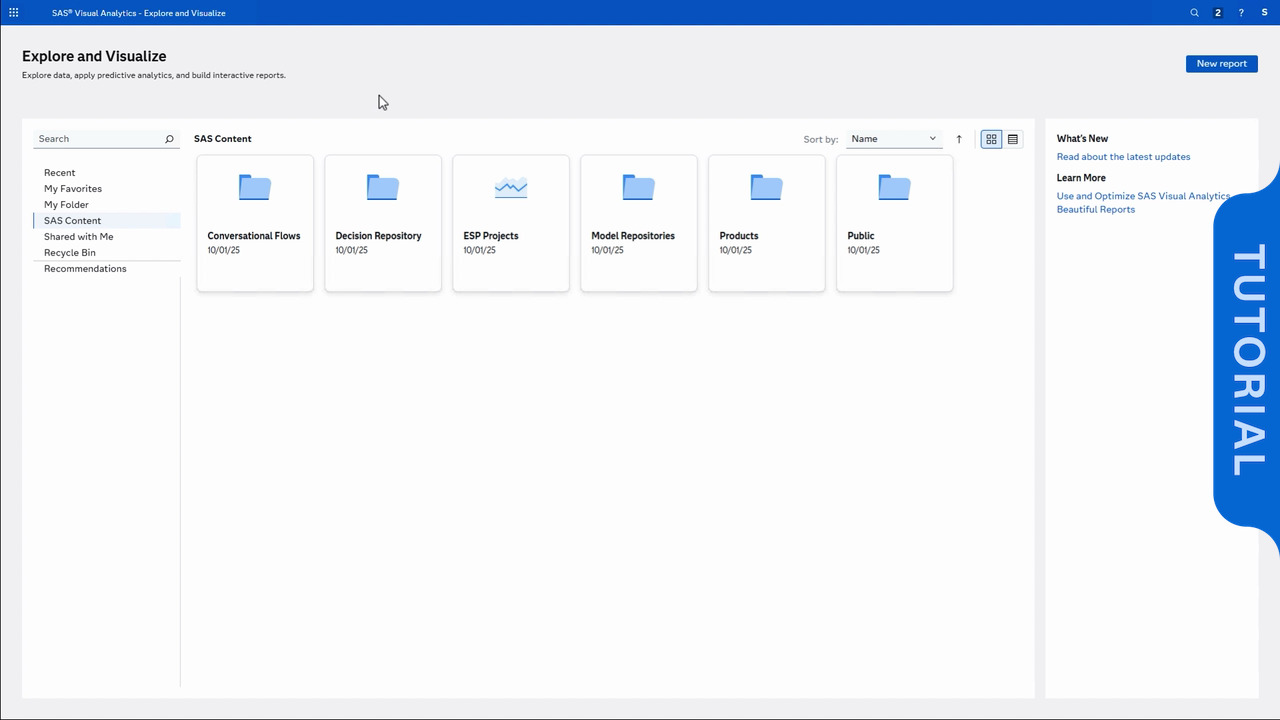
Automated Data Exploration Part 2
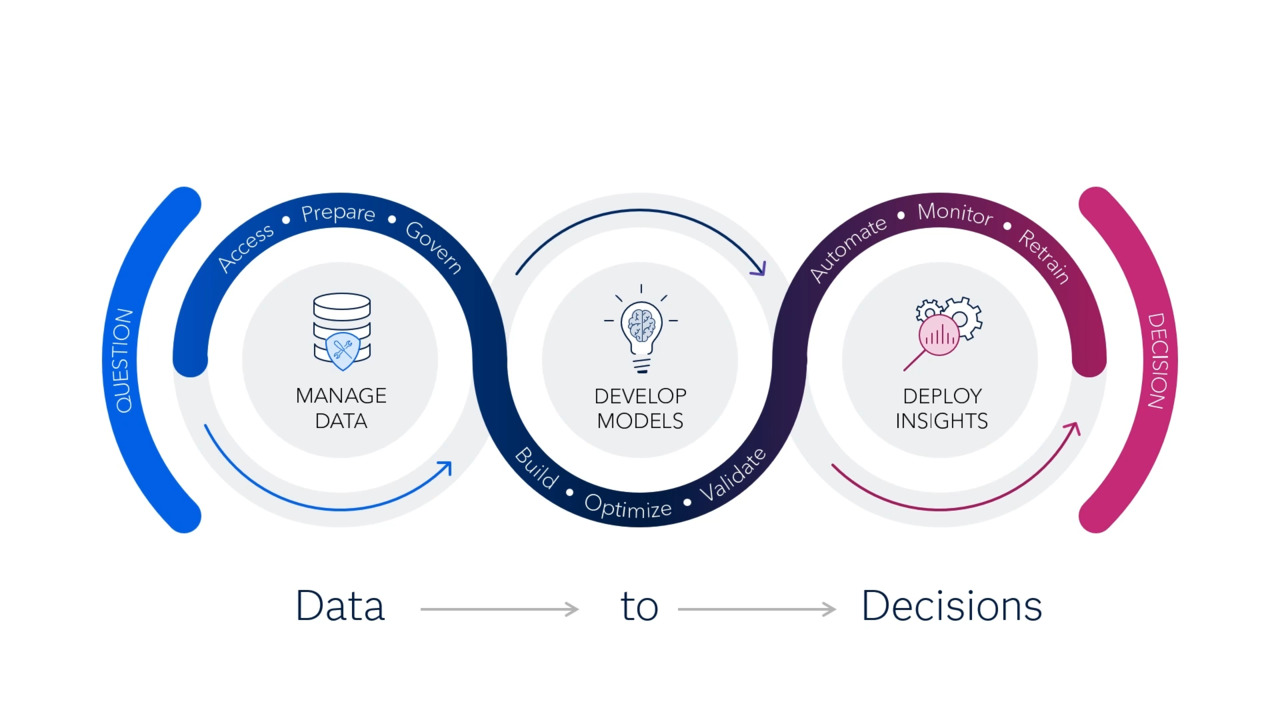
Learn about SAS Visual Analytics’s data exploration features that enables users to understand outliers impact, correlated variables and variable importance during data exploration stage of Data and AI Lifecycle
Read More
Read Less