Skip to collection list
Skip to video grid
SAS Viya
Using the Outline to Organize Content in a Report in SAS Visual Analytics on SAS Viya
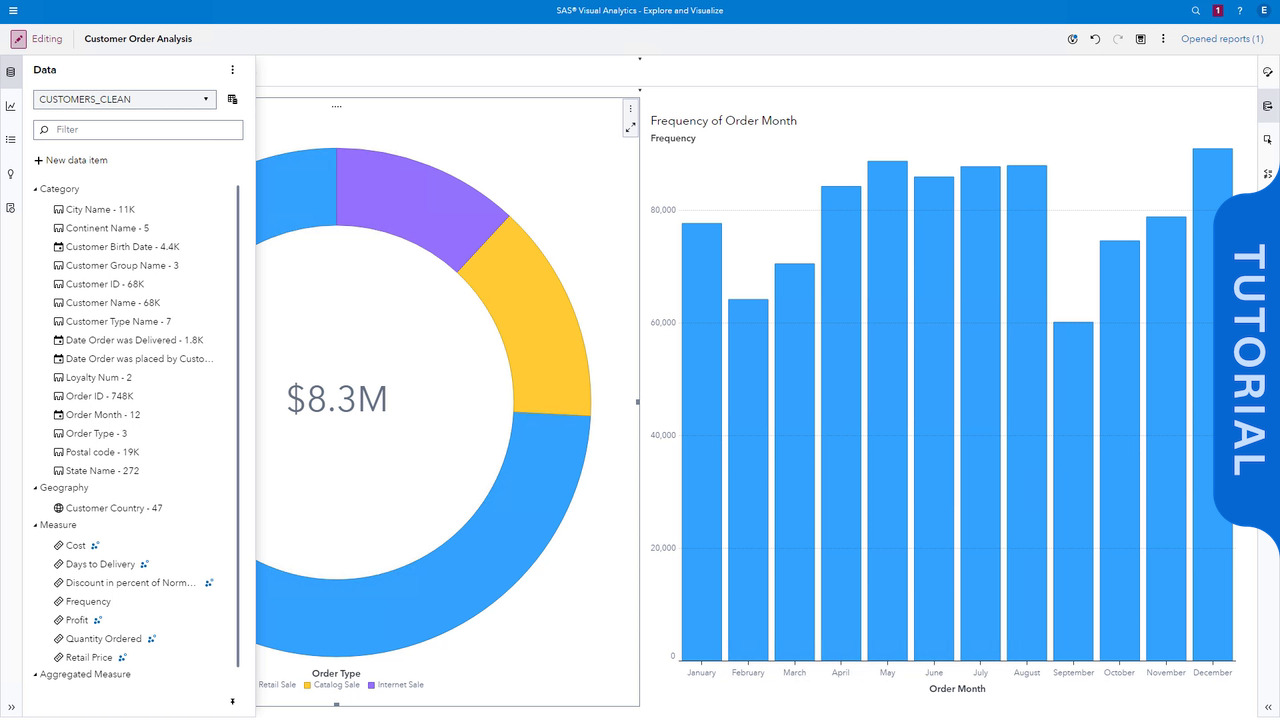
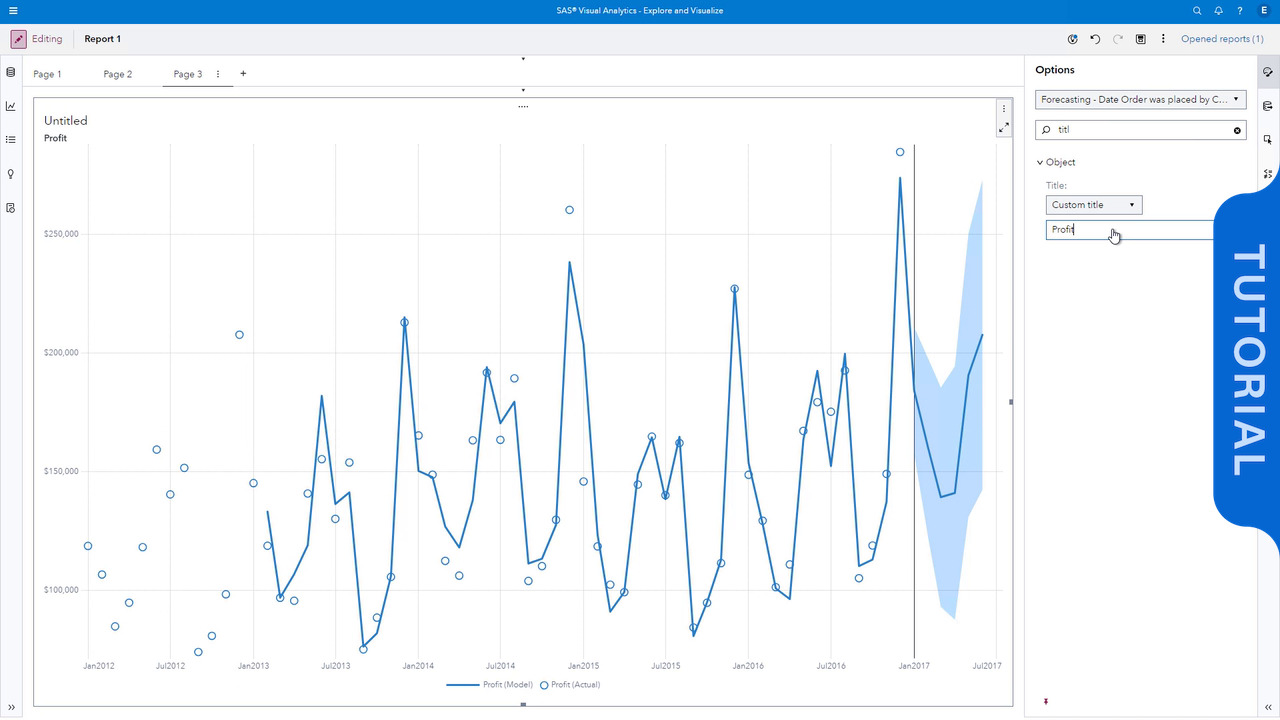
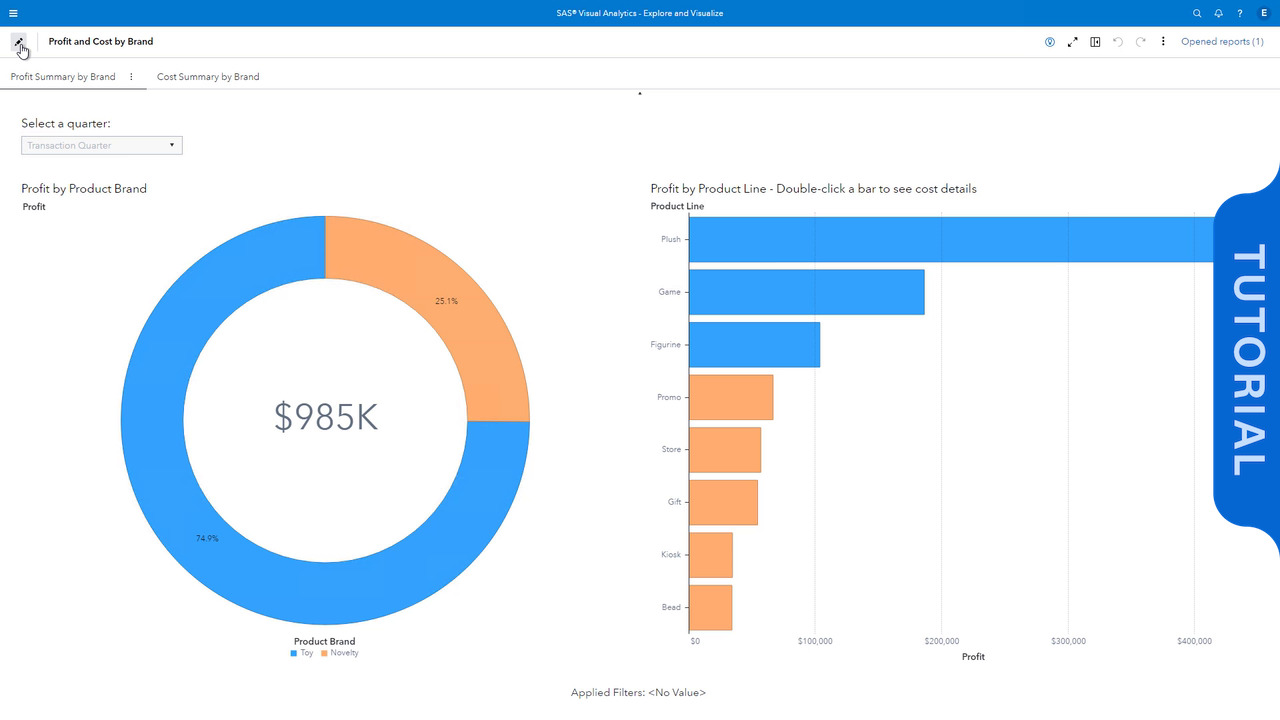
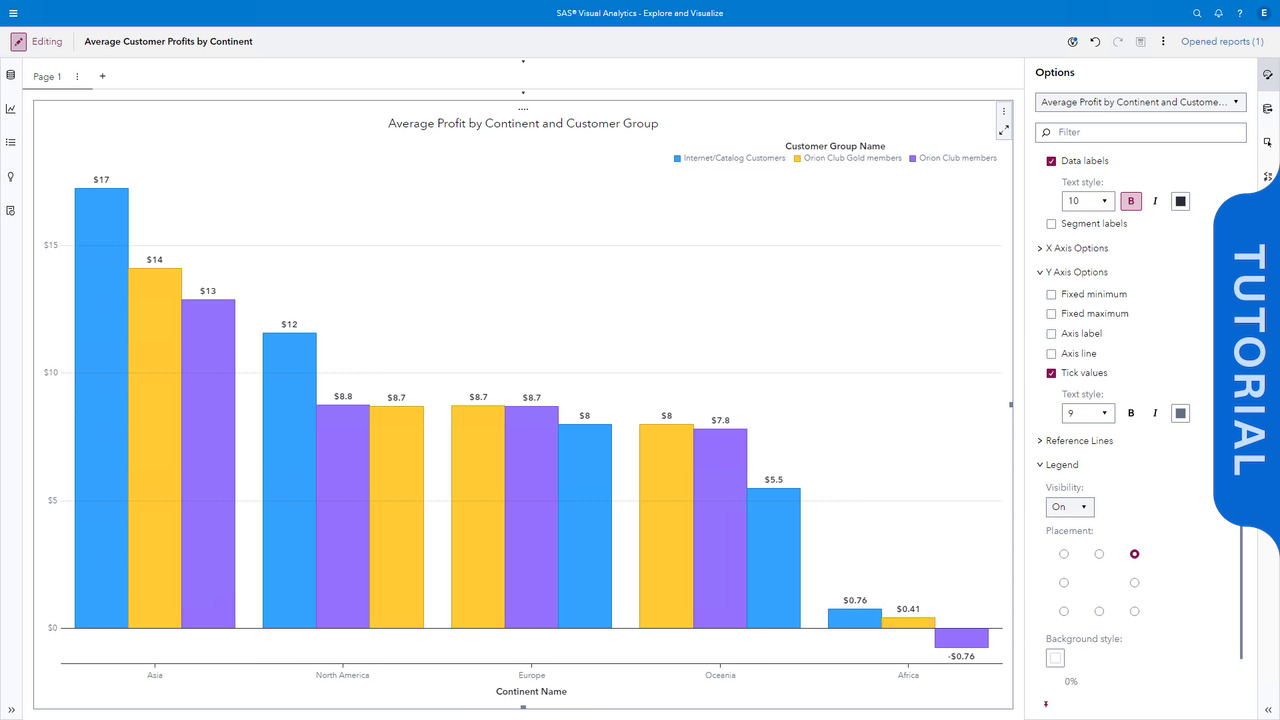
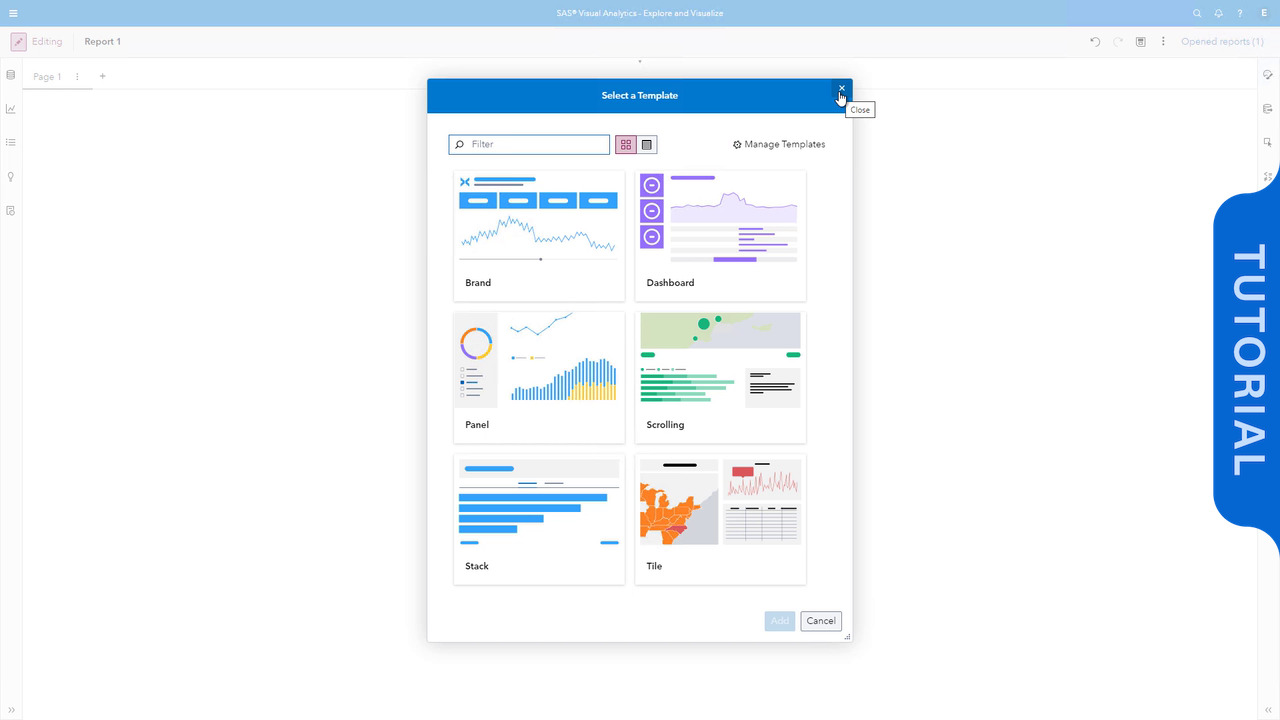
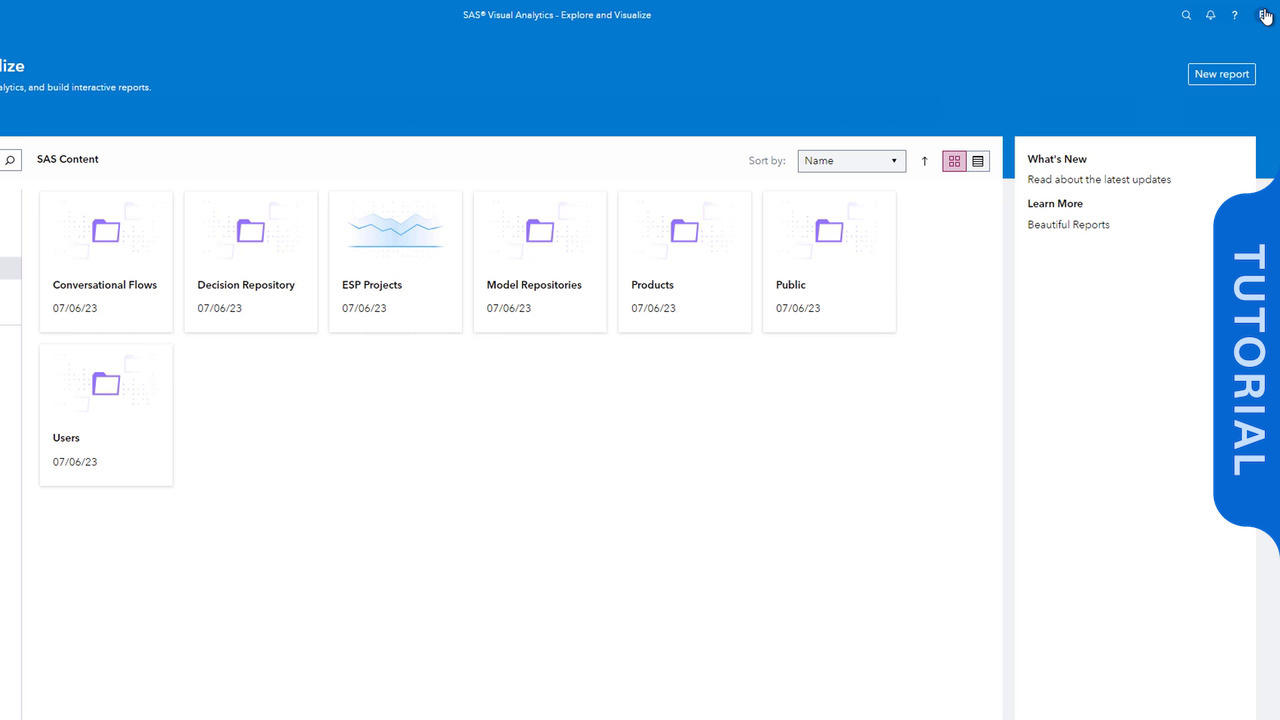
In this video, we open a multi-page report that has graph objects on each page. We use the outline capability to organize the report by moving objects to different pages. From the Outline pane, we can hide and unhide pages in the report.
Read More
Read Less
categories
View more in
Currently loaded videos are 1 through 15 of 181 total videos.
First page loaded, no previous page available
Load Next Page
Sort By:
Sort By:
Most Recent