Skip to collection list
Skip to video grid
SAS Viya
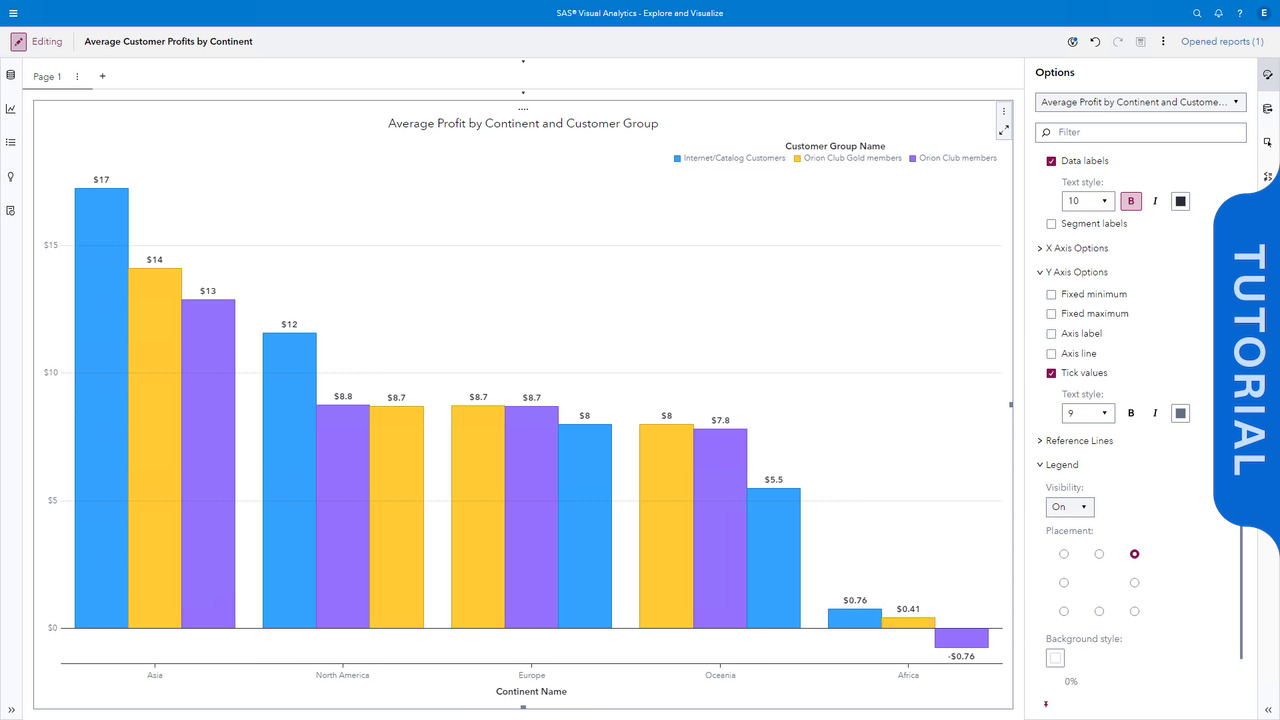
Creating Graphs by Using Explore Mode in SAS Visual Analytics on SAS Viya
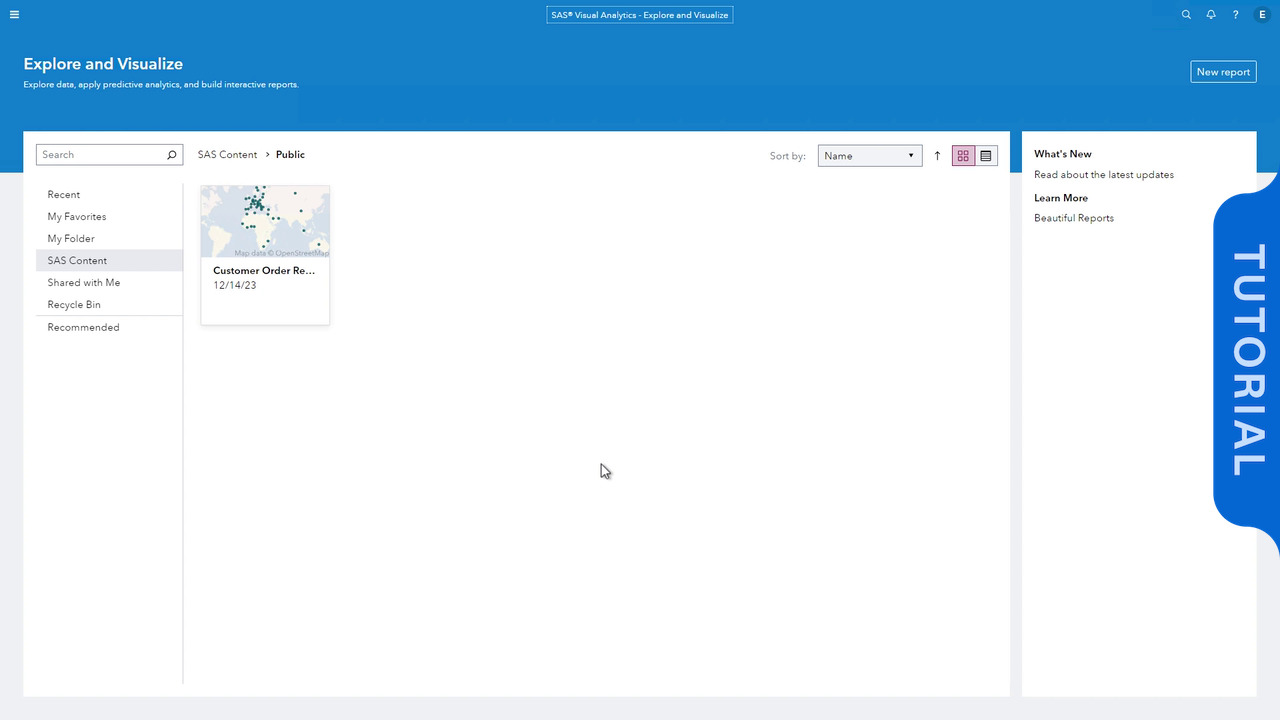
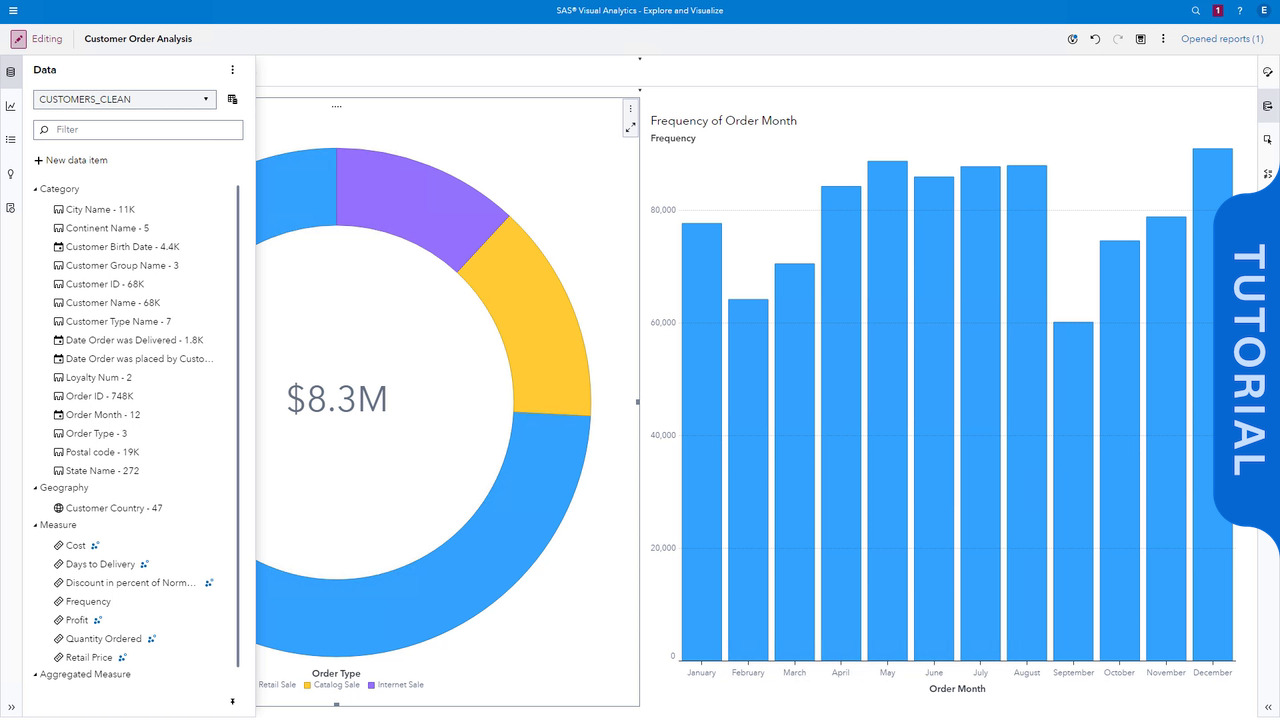
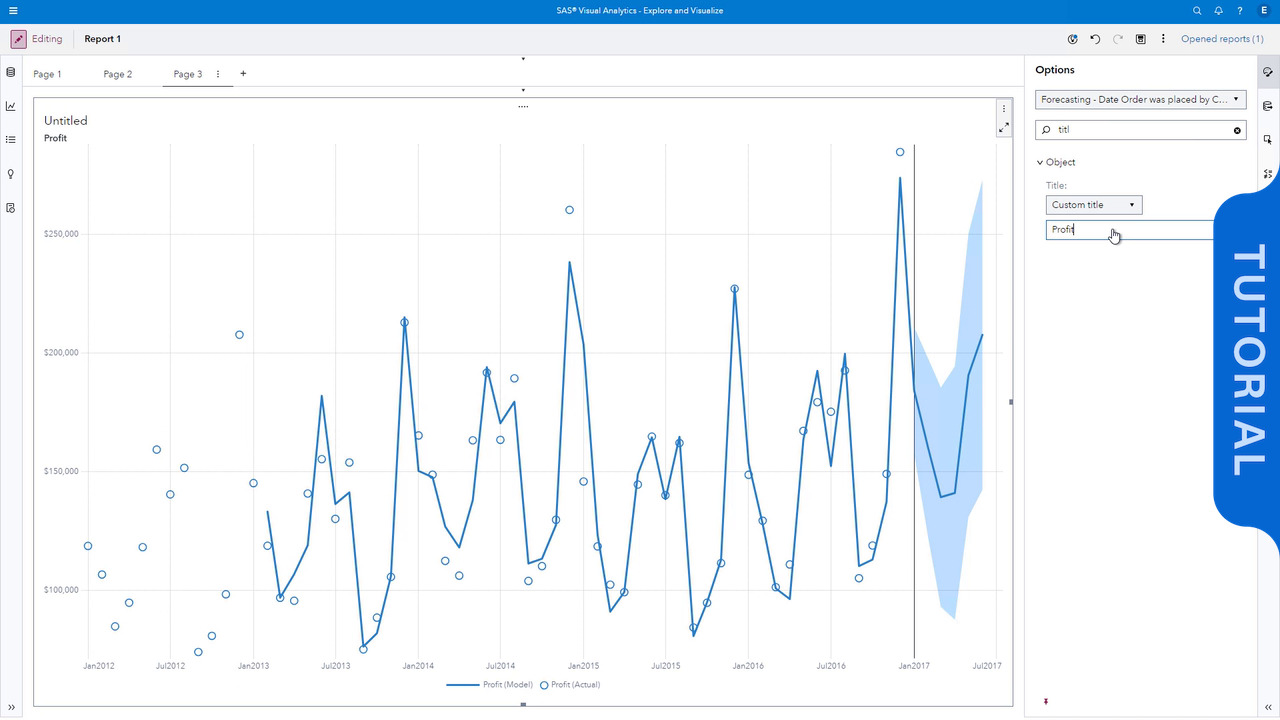
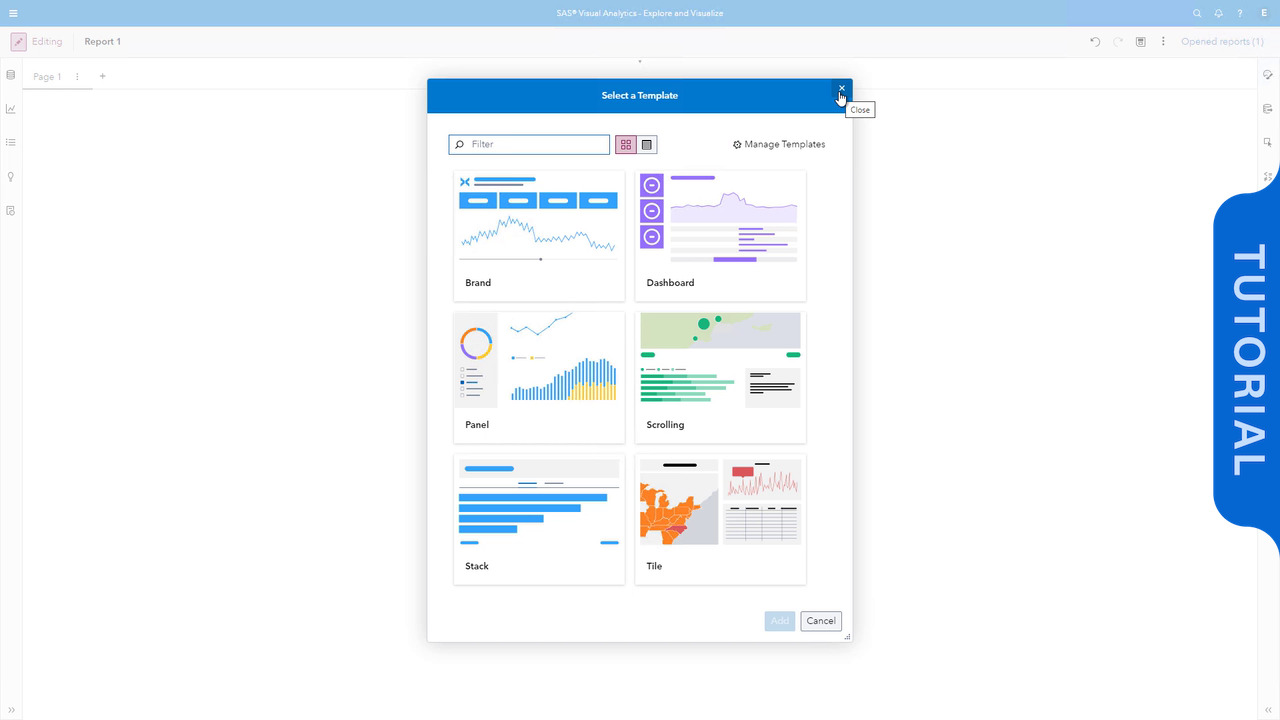
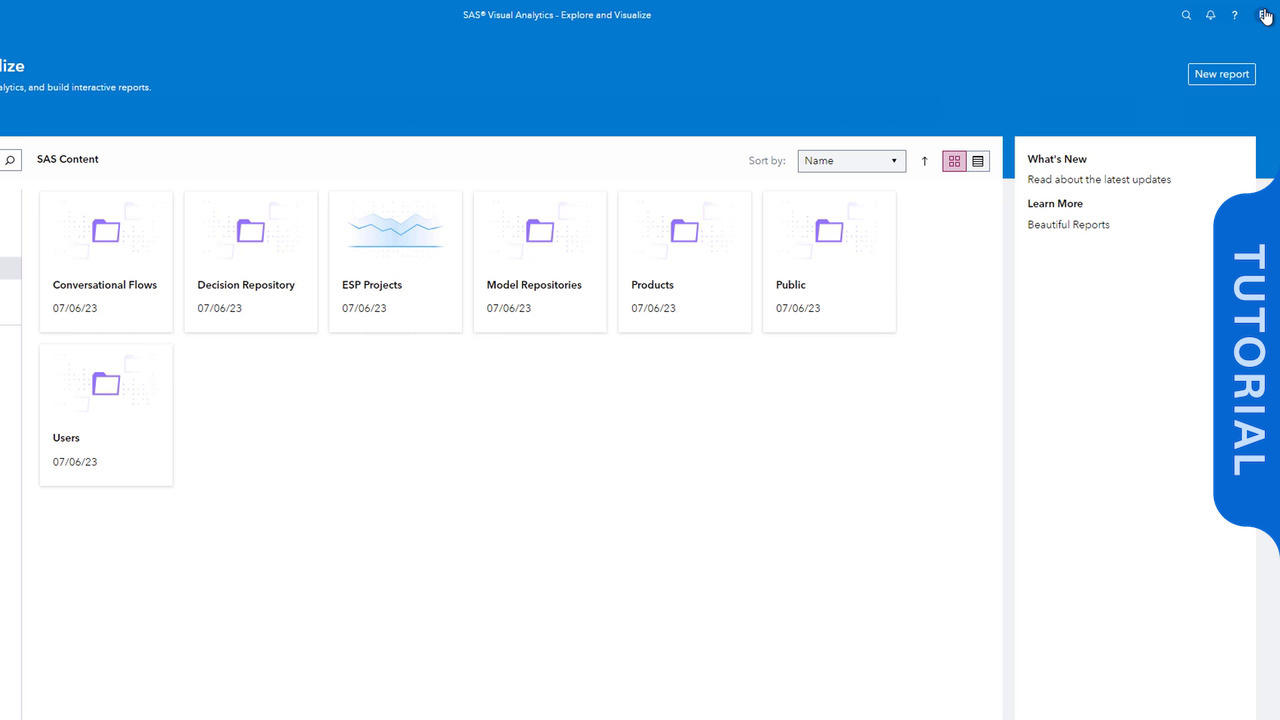
In this video, we open a report, switch to Explore mode, add a second object in the same page, and exit explore mode. After we exit Explore mode, the new object is automatically added to a new hidden page, which can be displayed.
Read More
Read Less
categories
View more in
Currently loaded videos are 1 through 15 of 181 total videos.
First page loaded, no previous page available
Load Next Page
Sort By:
Sort By:
Most Recent