Skip to collection list
Skip to video grid
SAS Viya
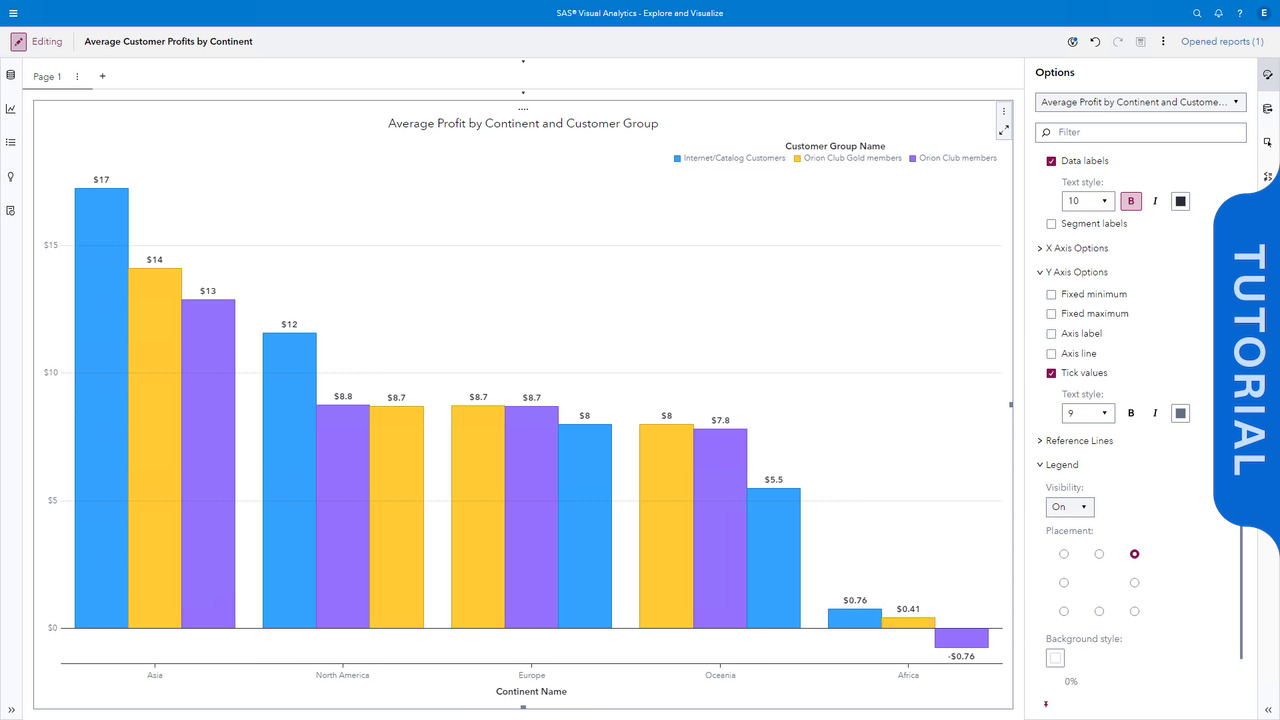
Duplicating and Changing Chart Types in SAS Visual Analytics on SAS Viya
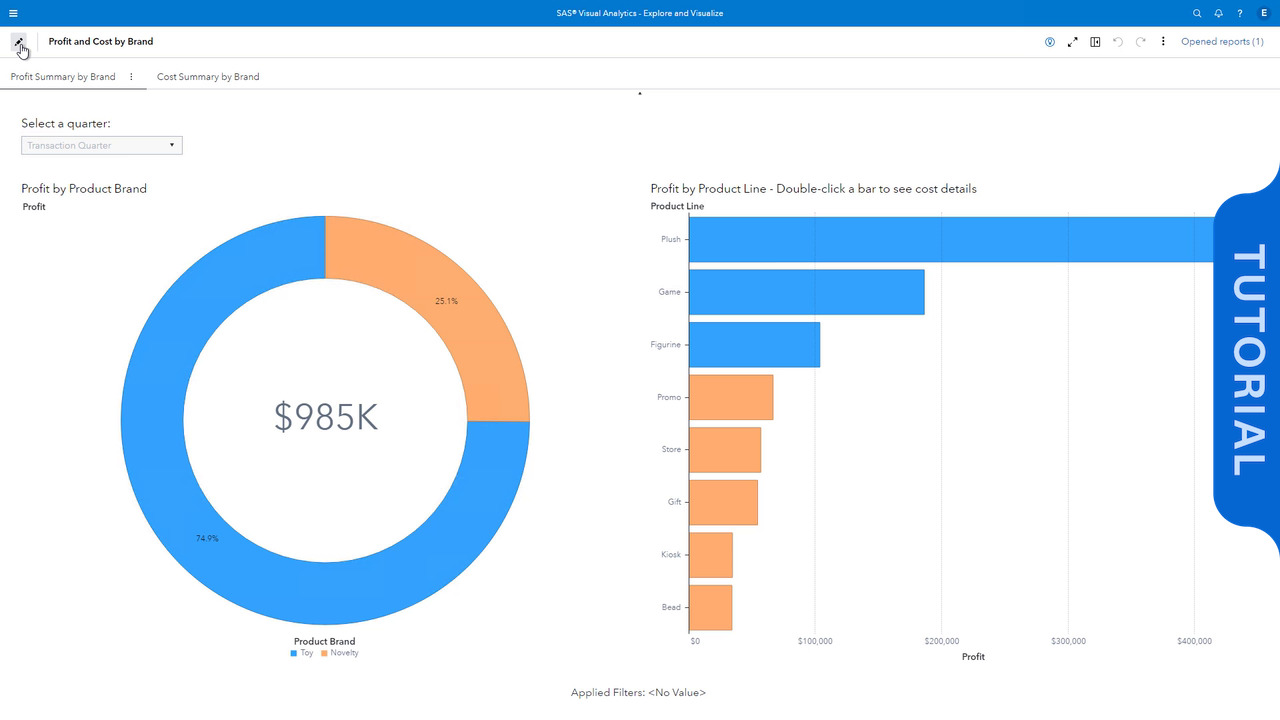
In this video, we open a report with a bar chart on the first page and a list table on the second. To view the data with a different perspective, we duplicate the bar chart and change the type. We use linking to see detail data in the list table.
Read More
Read Less
categories
View more in
Currently loaded videos are 1 through 15 of 181 total videos.
First page loaded, no previous page available
Load Next Page
Sort By:
Sort By:
Most Recent